Central Valley Multifamily Market Update: Oct. 2026
There’s a lot of data out there shedding light on different parts of the multifamily investment space. Here’s a quick overview of the numbers that matter most for Central Valley apartment owners right now: household income, interest rates, cap rates, and deal velocity.
Key Takeaways
- +55.6%: Central Valley median household income growth, 2016–2025
- 5.29%: 10-year Treasury yield as of September 30, 2026
- ~45%: increase in the return investors require since 2022 (average cap rate of 4.64% in Q2 2022 vs. 6.72% in Q2 2026)
- +29%: increase in deal velocity for 10+ unit properties, 2023–2025
Central Valley Household Incomes Are Up 55.6% in Nine Years
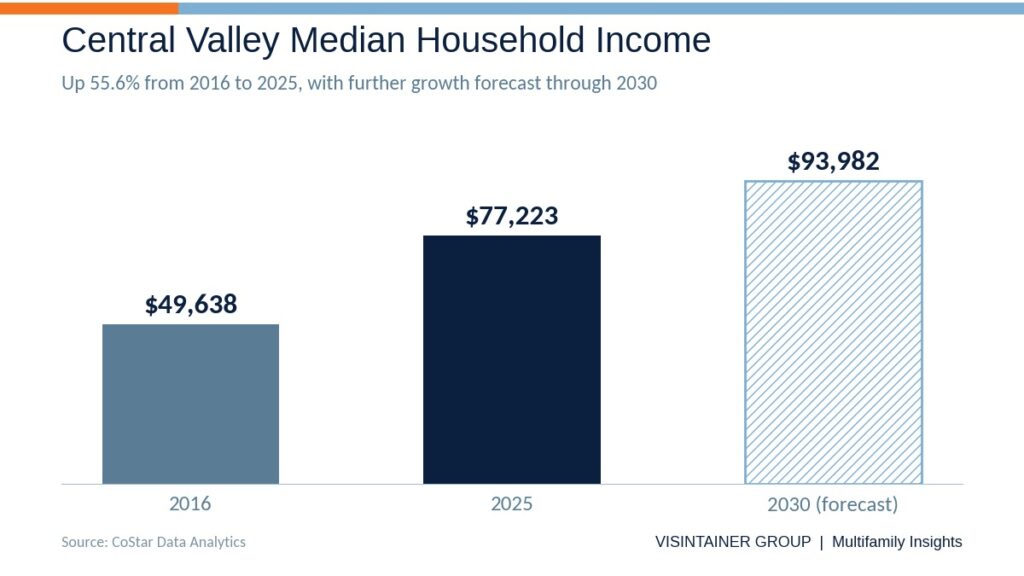 Central Valley median household income, 2016–2030 (forecast). Source: CoStar Data Analytics.
Median household income in the Central Valley climbed from $49,638 in 2016 to $77,223 in 2025, and is forecast to reach $93,982 by 2030.
Rising incomes support rents and occupancy. That fundamental is a driving force behind why multifamily has proven to be a resilient asset class over the past several decades, and why investors will continue to show interest in Central Valley apartments going forward.
Interest Rates: The 10-Year Treasury Is at Its Highest Level in Nearly Two Decades
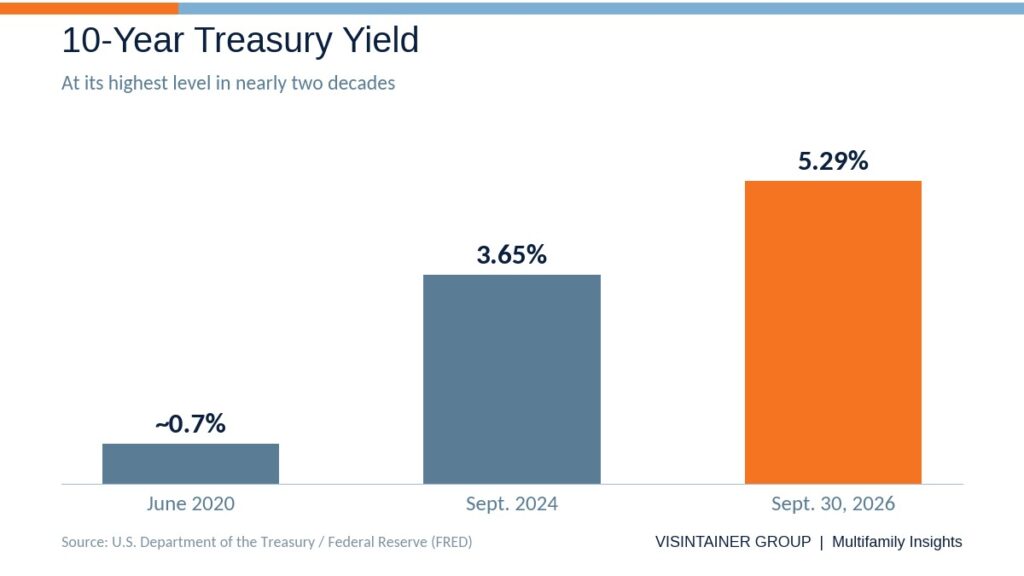
10-year Treasury yield, 2020–2026. Source: U.S. Department of the Treasury / Federal Reserve (FRED).
For years, low rates were a tailwind for multifamily. That changed in 2022, when rates began to climb. As of September 30, 2026, the 10-year Treasury sits at 5.29%, up from roughly 0.7% in mid-2020.
Over the past six years, the rate environment has fundamentally changed how buyers look at deals. Investors are more diligent and are scrutinizing deals more than ever.
Multifamily Cap Rates: Buyers Need ~45% More Return Than in 2022
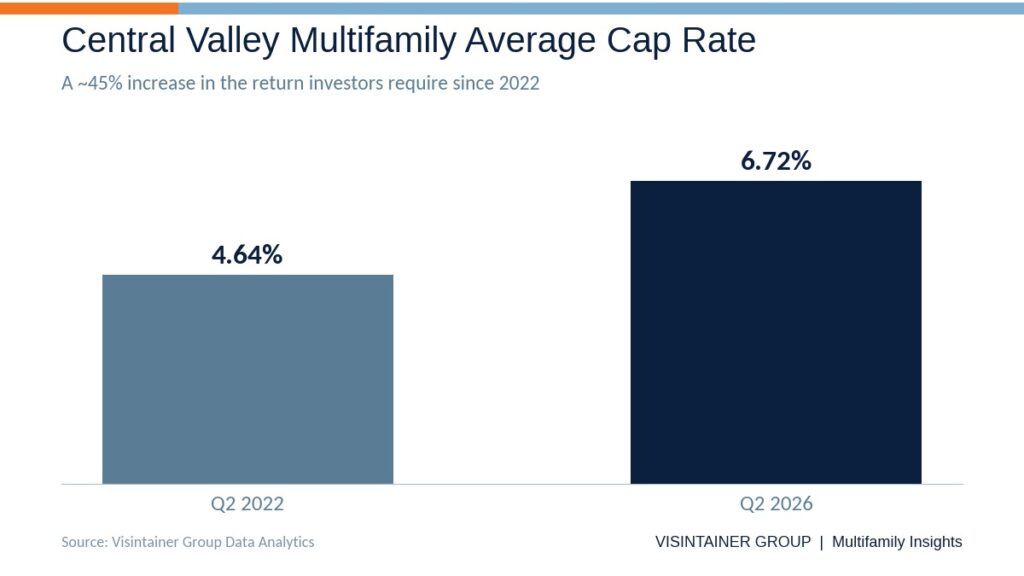
Central Valley multifamily average cap rate, Q2 2022 vs. Q2 2026. Source: Visintainer Group Data Analytics.
The average cap rate rose from 4.64% in Q2 2022 to 6.72% in Q2 2026. A two-point move may not seem like much on the surface, but it reflects roughly a 45% increase in the return investors need to get a deal done.
That said, when pricing is aligned, buyers are there.
Deal Velocity: Central Valley Apartment Sales Are Up 29% Since 2023
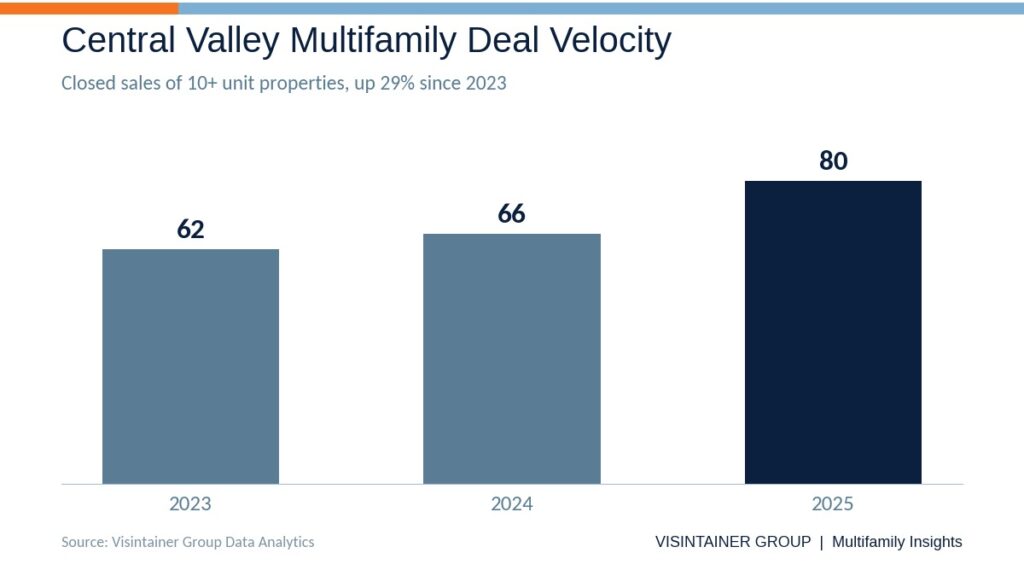
Closed sales of 10+ unit multifamily properties in the Central Valley, 2023–2025. Source: Visintainer Group Data Analytics.
Central Valley sales of properties above 10 units rose from 62 in 2023 to 66 in 2024 and 80 in 2025, a 21% jump in the last year alone.
Investors are still here and hunting for the right deal. While interest rates continue to have an effect, the fundamentals of housing and continued demographic tailwinds keep buyers motivated to put deals together.
What This Means for Central Valley Multifamily Owners
- The fundamentals are intact. Rising incomes and steady housing demand continue to support Central Valley multifamily.
- The buyer pool is disciplined, not gone. Higher rates mean deeper diligence and tighter underwriting, so preparation and presentation matter more than ever.
- Pricing alignment drives outcomes. Transactions are getting done. Understanding where your asset fits in today’s market is the first step, whether you plan to hold, refinance, or sell.
Frequently Asked Questions
What is the average multifamily cap rate in the Central Valley?
According to Visintainer Group Data Analytics, the average cap rate for Central Valley multifamily was 6.72% in Q2 2026, up from 4.64% in Q2 2022.
Are investors still buying apartment buildings in the Central Valley?
Yes. Closed sales of 10+ unit properties rose from 62 in 2023 to 80 in 2025, a 29% increase in deal velocity, even as interest rates climbed.
How do interest rates affect multifamily property values?
Higher rates raise borrowing costs and the return buyers require, which pushes cap rates up. Investors scrutinize deals more closely, so well-prepared properties that are priced in line with today’s market are the ones getting done.
Let’s Talk About Your Property
Every asset is different. If you’d like to know what these numbers mean for your property, I’m happy to walk through it with you, no obligation.
Blake Blackburn
Multifamily Investment Advisor, Visintainer Group
(559) 285-2983 | blake@visintainergroup.com
DRE 02047928 | visintainergroup.com
Sources: 10-year Treasury yields, U.S. Department of the Treasury / Federal Reserve (FRED). Median household income, CoStar Data Analytics. Cap rates and transaction data, Visintainer Group Data Analytics. Information is deemed reliable but not guaranteed and is provided for general informational purposes only; it is not a valuation of any specific property.